The Measured Move Trading Strategy: 5 Steps To Mastery
Today’s trading strategy is about a not so well-known trading pattern AKA the measured move. This measured moved chart pattern strategy is both a reversal and a continuation trading strategy.
Our team at Trading Strategy Guides is working hard to put together the most comprehensive guide to different chart pattern strategies.
In order to better understand chart patterns check out our Ultimate Chart Pattern Guide.
We’re going to dive deep into the measured move pattern, including guidelines on how you can profit from this mysterious pattern. Once you understand the measured move pattern it will open your horizons to better understand how price moves.
Moving forward, we’re going to discuss what makes a good measured move pattern and highlight five basic trading rules to conquer the markets by trading this amazing pattern.
Now onto the Measured Move Trading Strategy!
Table of Contents
Introduction: Measured Move Chart Pattern Strategy
Trading the measured move can refine your trading operations to a whole new level. What is surprising about the measured move pattern is that it shows you the market rhythm. Each trading instrument has its own rhythm and the Measured move pattern strategy can help you decode each market’s rhythm.
We’re also going to provide you with a very clear step-by-step set of rules so you can trade the Measured Move chart pattern strategy by yourself. Here is a strategy you can read about and it’s called risk to reward ratio.
What is a measured move in trading?
The measured move pattern is an old school chart pattern that states that the market has the tendency to move in a similar price structure to how it moved recently. Not just the price distance should be the same but also the time needed to reproduce the same move should be almost the same.
It’s based on the idea that historical price action often provides clues about future price movements.
When we talk about the measured move pattern, it’s not just about the distance traveled by the price – it’s also about the time it takes for that movement to occur. In essence, it’s looking for patterns where both the price structure and the time duration of a previous move closely resemble those of a current move.
For example, if the market makes a significant upward move over the course of, say, two weeks, the measured move pattern suggests that a subsequent upward move of similar magnitude might occur in a similar time-frame. This means that not only would the price levels reached be similar, but also the speed and duration of the move would closely match.
Measured moves can be found in all markets and in all-time intervals. See below to learn about the two types of measured move patterns there are. By identifying these patterns, they aim to anticipate potential price movements and make informed trading decisions based on historical precedents.
As a disclaimer, it’s important to remember that while patterns like these can provide valuable insights, they’re not foolproof and should be used in conjunction with other technical analysis tools and risk management strategies.
Measured Move Up Pattern (Bullish)
Let’s say the price action starts from pivot low A and it rallies up to a pivot high called B. Then it drops from pivot B down to C and it rallies one more time to a new pivot high D.
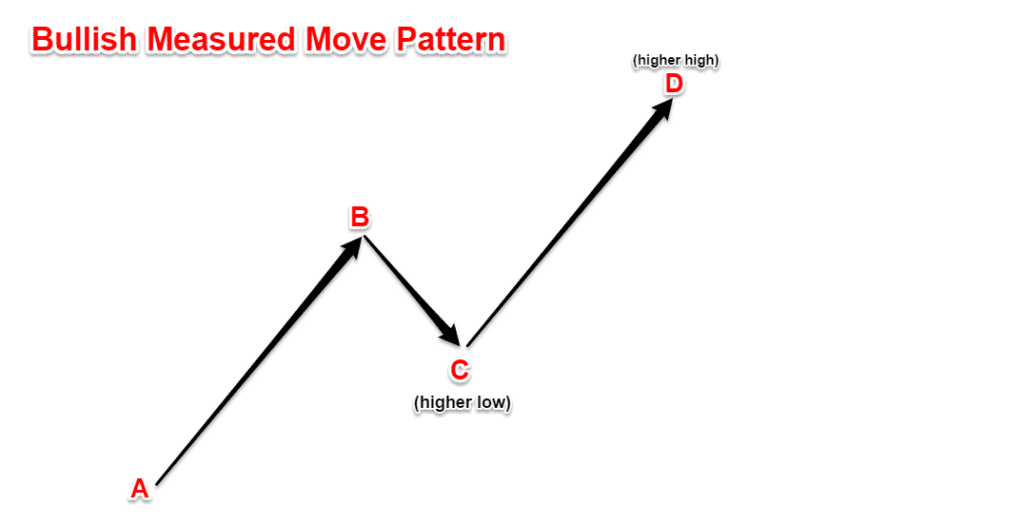
Now, this price action is known as the measured move up pattern or a bullish measured move.
A valid price structure happens when we have a higher low at pivot C and a higher high at pivot D.
You might be asking yourself how the measured move works. The answer is that the CD leg is always measured as a percentage against the AB leg. In a Forex measured move, the CD leg should be equal to the AB move.
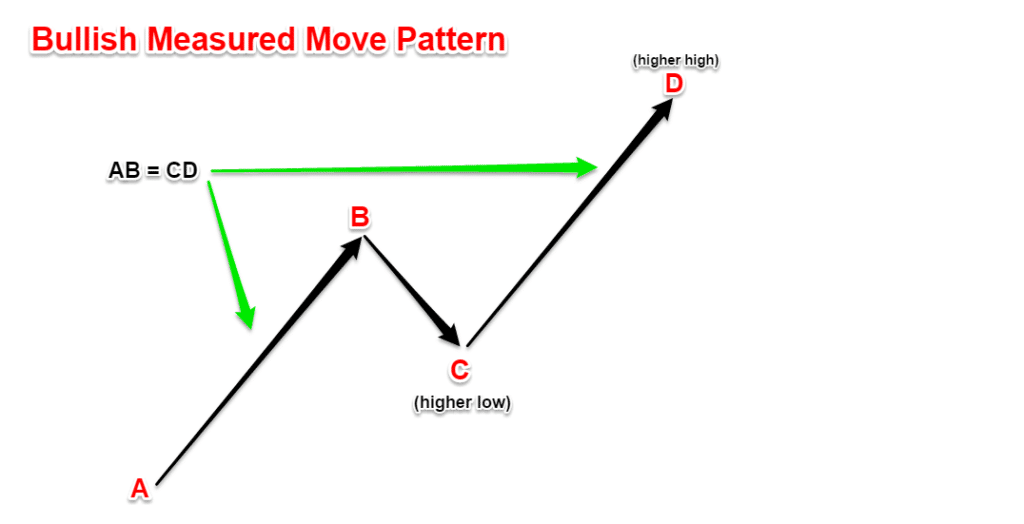
Note * From our personal experience we’ve found that the CD leg tends to be greater than AB.
Measured Move Down Pattern (Bearish)
Let’s consider a scenario where the price action originates from a pivot high, labeled as A, and then rallies downward to form a pivot low, known as B. Following this, it experiences a brief upward movement from pivot B to point C, and subsequently, it undergoes another drop to establish a new pivot low at point D.
This sequence of price action characterizes what we call the measured move down pattern, or the bearish measured move.
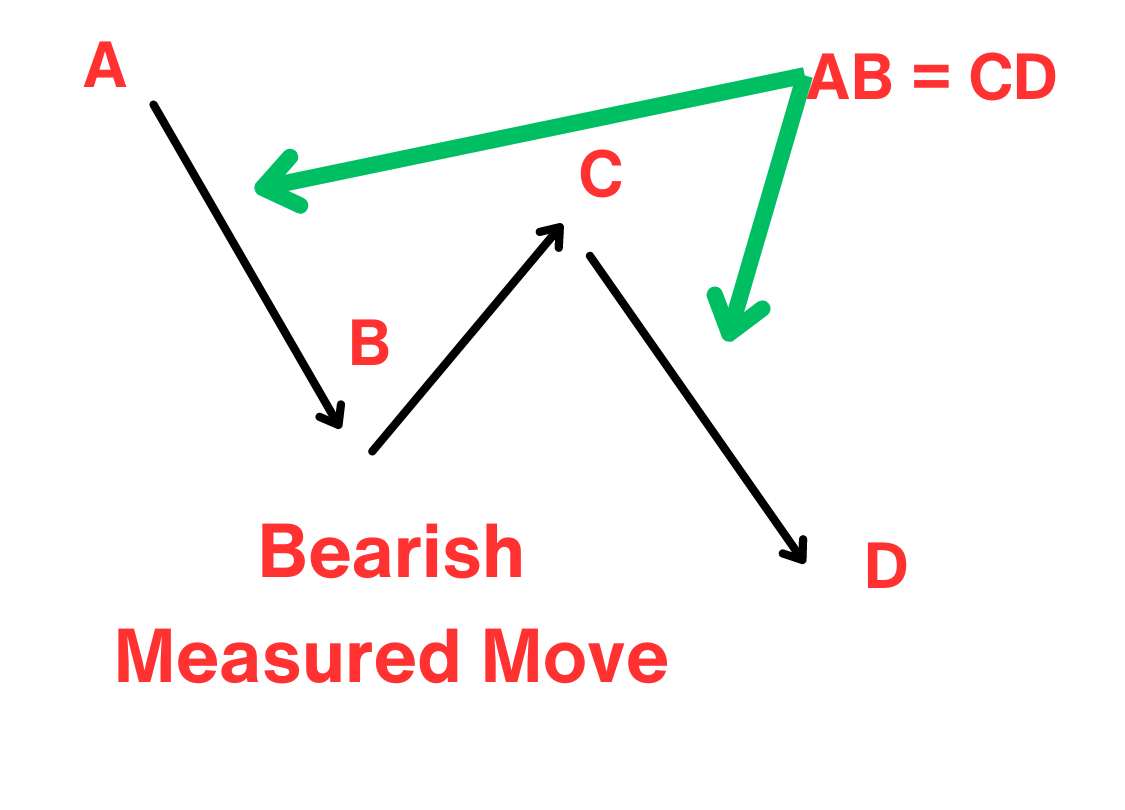
A bearish measured move pattern typically exhibits a lower low at pivot D compared to pivot B, along with a lower high at pivot C compared to pivot A.
As you can see, the measured move down pattern moves inversely to the measured move up pattern.
Now, let’s see how you can effectively trade with the measured move pattern strategy and how to make profits from basically using no technical indicator.
The Psychology behind the bullish measured move.
Trading with the measured move pattern will give us clues into the trend direction and also the trend strength.
The strength of the trend stands in the BC retracement. We’re going to use the 50% retracement of the AB price range as a guide for trading the measured move and assert the strength of the trend.
If point C retrace less than 50% of AB range before trading above point B than we can declare this uptrend to be very strong. However, if the retracement at C falls below 50% then we can conclude the trend is weak.
You won’t be able to call the forex measured move until later in the actual development of the pattern. But after you have got the first leg to the upside we should expect the same thing duplicated on the second leg, so trading with the measured move pattern should be an easy job.
Measured Move Trading Strategy – Buy Rules
The measured move chart strategy is an easy way to make money trading Forex. You simply have to employ this step-by-step guide on how to use the measured move and you’ll be in tune with the market rhythm.
In essence, trading the measured move is simply an attempt to predict how far the market will continue to move after a price event.
Moving forward, we present the buy side rules of the measured move strategy:
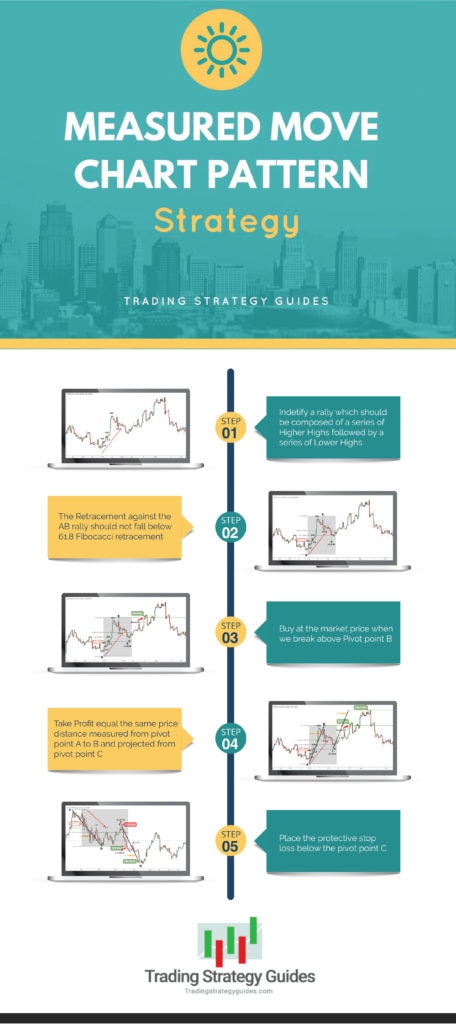
1. Identify a rally
To identify the rally you should be observing a series of Higher Highs followed by a series of Lower Highs
The first stage of the Forex measured move as the name suggests is a bullish trend.
Our team at TSG defines the trend very simply. For an uptrend or a bullish trend, we look for a series of higher highs followed by a series of higher lows.
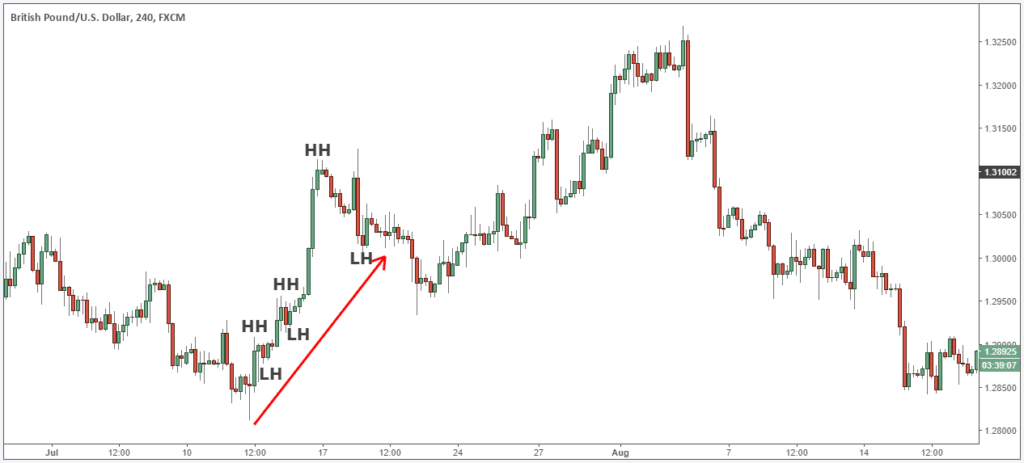
This is the first part of the measured move price structure and can be ad noted as the AB leg (see figure below).
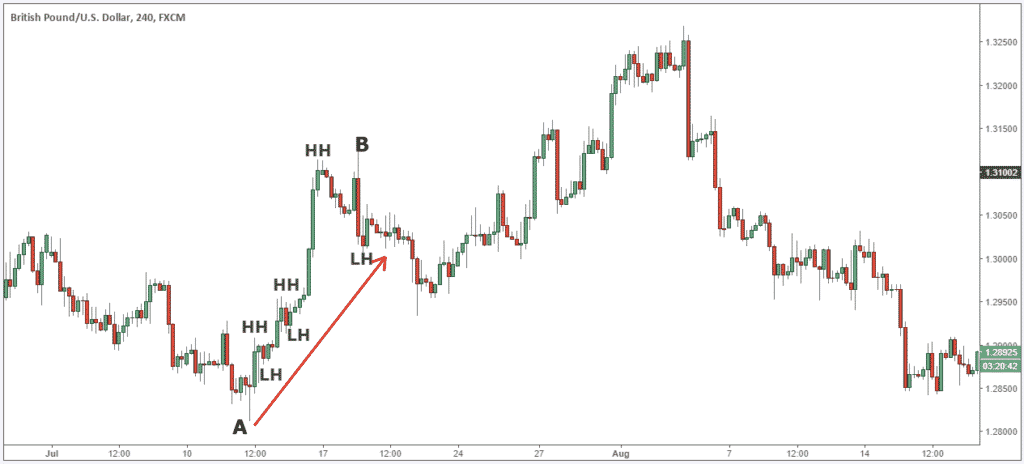
Now …
We need to define one more element of this unique trading pattern before outlining our entry technique.
2. Retracement
As a general rule, the measured move strategy performs best when the retracement against the first leg higher doesn’t fall below the 61.8% Fibonacci retracement. Ideally, we want to see the retracement to stay above the 32.8% Fibonacci retracement.
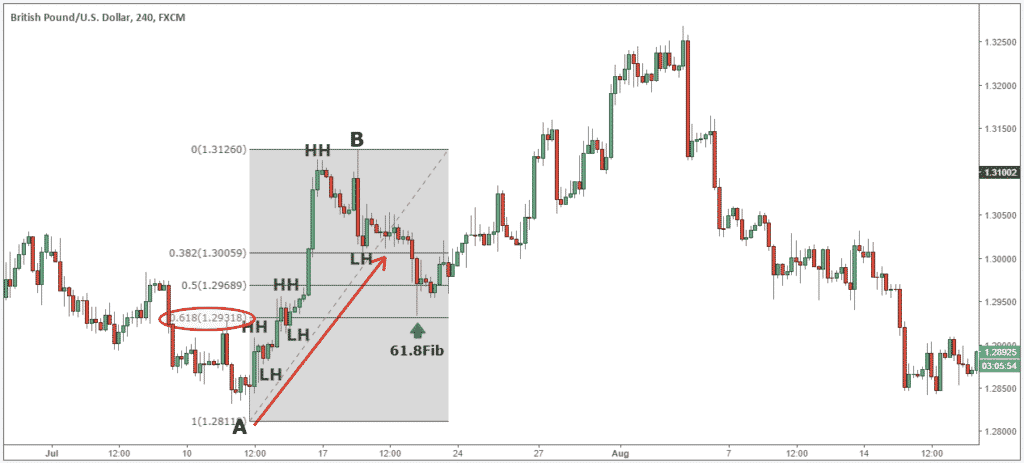
In our case, we can note, that the retracement doesn’t fall below the 61.8% Fibonacci retracement which complies with the rules of the measured move rules.
The retracement ends at the pivot point C
So far, so good.
Now we need to define our entry technique which brings us to the third step of the measured move chart strategy.
3. Buy the measured move up pattern
The measured move chart strategy uses a very simple entry technique.
We want to buy at the market as soon as the price breaks above the Pivot point B.
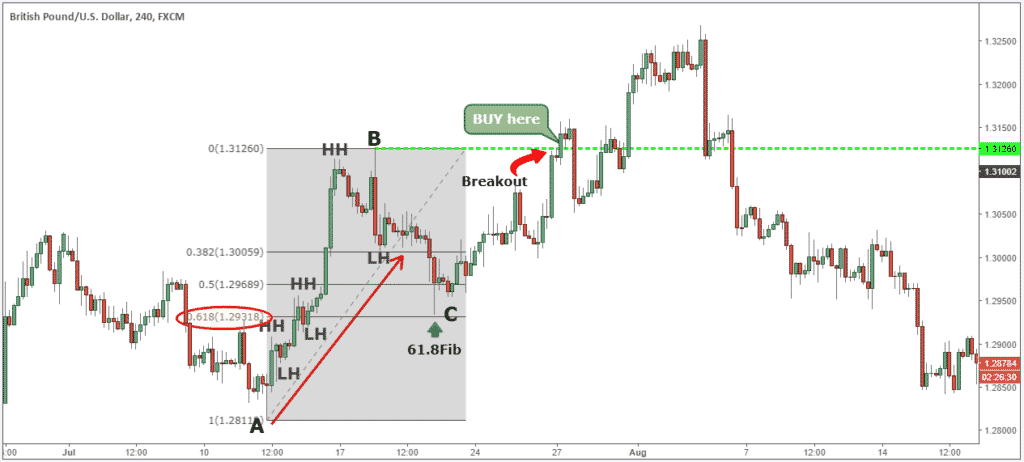
The next logical thing we need to establish for this market trading strategy is where to take profits.
See below…
4. Take Profit
In the case of the measured move pattern, we can determine how much the next leg higher will go and how much time it will approximately take to reach that target.
The measured move up pattern in Forex requires you to know the price distance of the first rally (AB-leg) and then project to the upside the same price distance starting from pivot point C.
This is how you can determine the potential target for the measured move chart pattern.
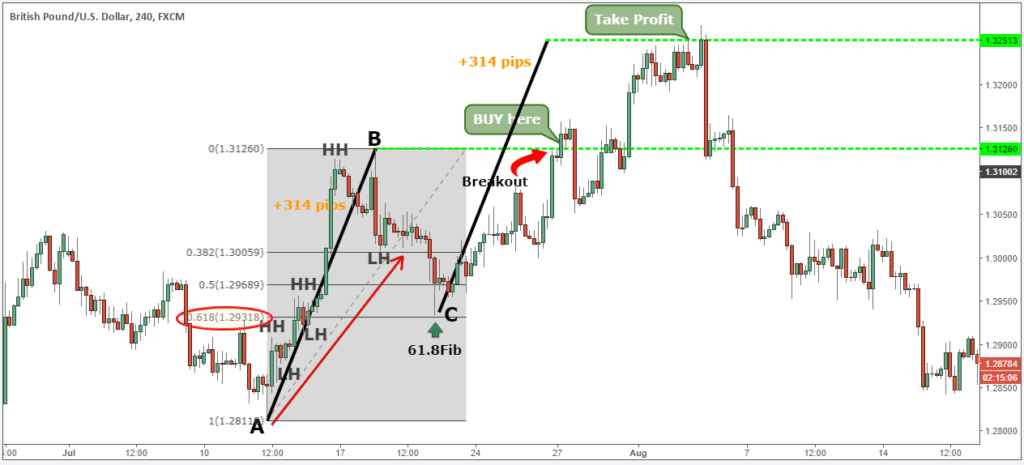
If you haven’t noticed we’ve used the measured move trading concepts in many of our strategies like in the Price Channel Pattern or the Double Bottom Chart Pattern.
The measured move rules can be applied to any geometrical price action. And it’s a great trade technique to fine-tune your exit technique.
The next important thing we need to establish is where to place your protective stop loss.
See below…
5: Stop Loss Placement
A common approach when trading the measured move is to hide your protective stop loss just below the pivot point C.
You can use different stop loss techniques as well, like placing the SL below the pivot point A but this comes with taking a much bigger stop loss.
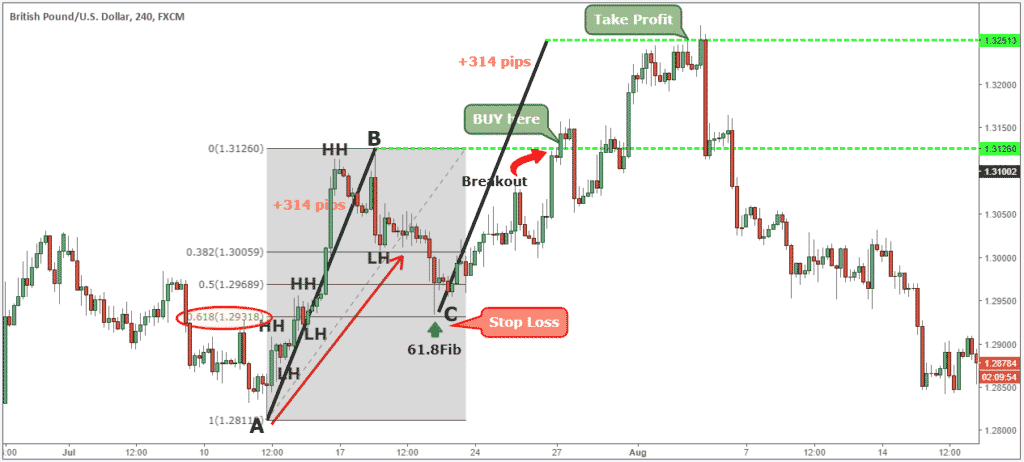
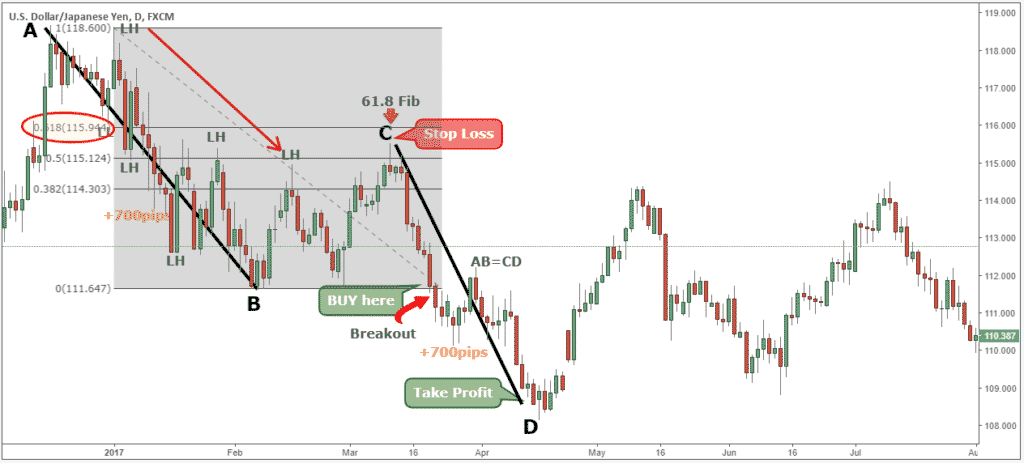
Note*** The above was an example of a measured move up pattern BUY trade… Use the same rules – but in reverse – for a measured move down pattern SELL trade.
In the figure below, you can see an actual measured move down pattern SELL trade example, using this new innovative approach to technical analysis.
Measured Move Trading Strategy Video
Measured Move Trading Strategy FAQs
What is an example of a measured move?
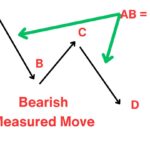
Let’s imagine a scenario where the price movement begins with a pivot high, denoted as A, and then proceeds to decline, forming a pivot low, referred to as B. Subsequently, there’s a brief upward rally from pivot B to point C, followed by another downward movement, leading to the establishment of a new pivot low at point D.
This sequence of price behavior defines what is commonly known as the measured move down pattern, or more specifically, the bearish measured move.
What is the measured move down pattern?
A measured move down pattern, also known as a bearish measured move, is a technical analysis chart pattern that is used to identify potential downward price movements in the financial markets.
This pattern typically occurs after a prolonged downtrend or during a reversal from an uptrend.
In a measured move down pattern:
1. The price initially experiences a downward movement, forming a pivot high (labeled as A).
2. Subsequently, the price rallies upward briefly, forming a pivot low (labeled as B).
3. Following this temporary upward movement, the price resumes its downward trajectory, forming a new pivot low (labeled as D).
The pattern is characterized by a series of lower highs and lower lows, indicating the overall bearish sentiment in the market.
Traders often use this pattern to anticipate further downside potential, with the expectation that the magnitude of the downward movement from pivot B to pivot D will be similar to the earlier downward movement from pivot A to pivot B.
What is a measured move chart pattern?
A measured move chart pattern, also known as a measured move setup, is a chart pattern used in technical analysis to spot symmetrical movements in the market.
In its basic form, a measured move chart pattern consists of three key components:
1. Initial Move: The pattern begins with an initial price movement, often characterized by a sharp rally or decline, referred to as the “impulse move” or “leg.” This initial move is typically followed by a consolidation or correction phase.
2. Correction or Consolidation: Following the initial move, the price tends to undergo a period of consolidation or correction, during which it retraces a portion of the impulse move. This phase may involve sideways movement or a counter-trend retracement.
3. Measured Move: After the consolidation phase, the price resumes its previous trend, either upward or downward, mirroring the magnitude of the initial move. Traders project the potential price target for the measured move by extrapolating the distance of the initial move from the point of breakout or confirmation of the pattern.
Conclusion: Measured Move Trading Strategy
The measured move chart pattern strategy is a very surprising trading strategy that can be incorporated into your own trading. This trading technique is not the Holy Grail but it’s very helpful to be used to determine potential profit targets. We also have training for Forex Basket Trading Strategy.
The bullish measured move basically is a trend continuation candlestick pattern suitable to be traded on all time frames. Trading the measured move will get you in sync with the market rhythm and you’ll no longer be trading based on random numbers.
Thank you for reading!
Please leave a comment below if you have any questions about Chart Pattern Strategy!
Also, please give this strategy a 5 star if you enjoyed it!
Measured Move Trading Strategy Info-Graphic
Please Share this Measured Move Trading Strategy Infographic below and keep it for your own personal use! Thanks Traders!




So you are advocating for a less than 1:1 reward to risk? Target is 314 pips but stop loss seems to be about 500 pips? Why? You’d need at minimum a 70% win rate. Also, advocating to buy as soon as price breaks above B? In this market environment? So many false breakouts. I bet very few traders reading this article can afford the target and stop loss you have detailed here.