Demarker Indicator Strategy – Sniper Market Timing

Demarker Indicator Strategy – Sniper Market Timing
The Demarker indicator strategy will help you time the market with the precision of a sniper. In this trading guide, we’re going to highlight three different practical examples of how the Demarker indicator can be used. You’re going to learn how to use Demarker as a stand-alone indicator, but also how it performs in combination with other tools.
If this is your first time on our website, our team at Trading Strategy Guides welcomes you. Make sure you hit the subscribe button, so you get your Free Trading Strategy every week directly into your inbox.
Our mission is to put together the best Demarker trading guide on the market. We hope this guide will help traders in their own trading process and in their trade timing decisions.
What is market timing?
Market timing is the ability to get in and out of the market with a high degree of accuracy. You can use price action alone or make use of different technical tools to make anticipatory decisions about the future price direction.
By the end of this step-by-step trading guide, you’ll have a good understanding of how professional traders and money managers use the Demarker indicator.
Moving forward, we’re going to outline the basic understanding behind Demarker tool and how it can help you to make a profit in the market.
Demarker Indicator
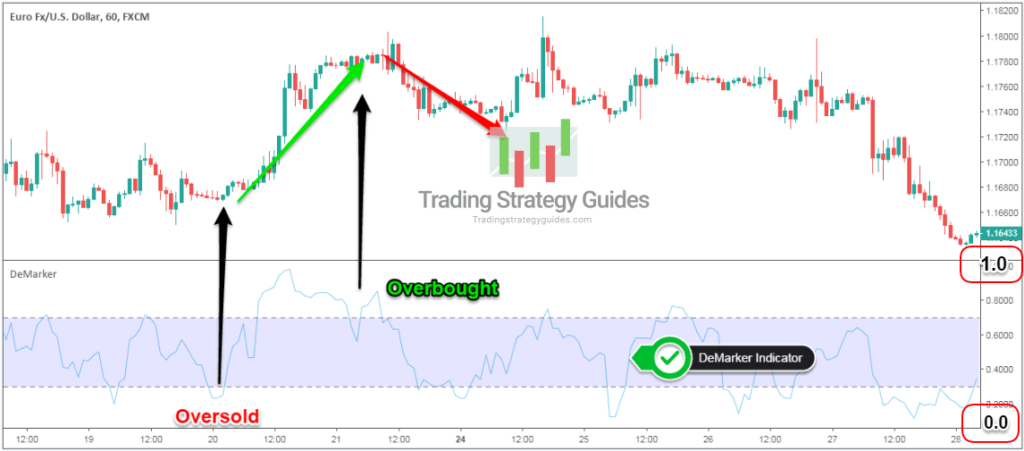
The Demarker indicator is an oscillator that displays potential overbought and oversold conditions in the market. Being part of the oscillator family of technical indicators, this technical tool oscillates over time within a band between the 0 and 100 levels (or 0.0 and 1.0).
The Demarker technical indicator was developed by Tom Demark, a modern Market Wizard.
Who is Tom Demark?
Tom Demark is a legendary trading guru who makes regular appearances as a guest on Bloomberg TV and CNBC. If that doesn’t say enough, he was also a financial advisor for Steven A. Cohen of Point 72 Asset Management. Steven Cohen is probably one of the most successful hedge fund managers of our time.
Paul Tudor Jones, the legendary hedge fund manager who called the October 1987 crash, was also one of Demark’s former clients.
Tom Demark indicators are well-known for their mechanical-driven approach that leaves no room for any type of misinterpretation. Tom Demark indicators have been applied in the market since the 1970s to today across the stock market, futures market, fixed income market, and Forex currency market.
So, Tom Demark’s technical indicator passes the test of time.
Let’s now see some practical examples of how to use Demarker indicators and how the Demarker indicator works.
How Demarker Indicator Works
The Demarker technical indicator, also known as DeM, measures the demand for an asset by comparing the most recent high and low prices to the previous high and low prices. This will give the general directional bias of the market.
There are two components that make up the Demarker oscillator:
- DeMax – compares the current candle high to the previous candles high.
- DeMin – compares the current candle low to the previous candles low.
These two components are then put together to create the Demarker oscillator, following the below formula:
DeM = SMA(DeMax) [SMA(DeMax) + SMA(DeMin)]
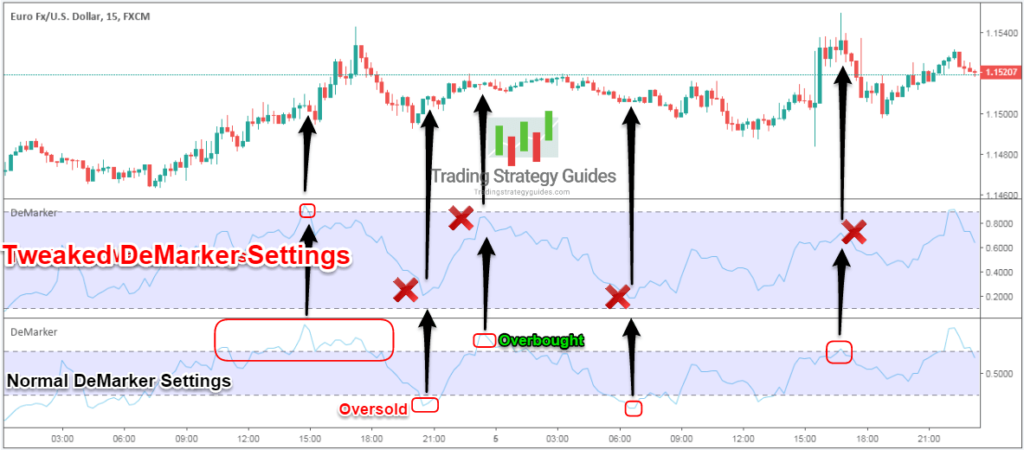
Our preferred Demarker setting is to use a parameter value of 13 periods. We also like to tweak the overbought and oversold levels and instead of using the classical 0.7 and respectively 0.3 levels we use the 0.9 and respectively 0.1 levels.
We only like to look for extreme market exhaustion readings.
In the figure below, you can see the difference between default Demarker settings and tweaked settings:
Understanding the concept of speed and the subtleties of what speed can tell us about market exhaustion and market reversal can improve our timing.
Market timing is everything, especially in volatile markets. The volatile markets tend to produce big price swings, so a timing indicator like Demarker, will give you an edge in this type of environment.
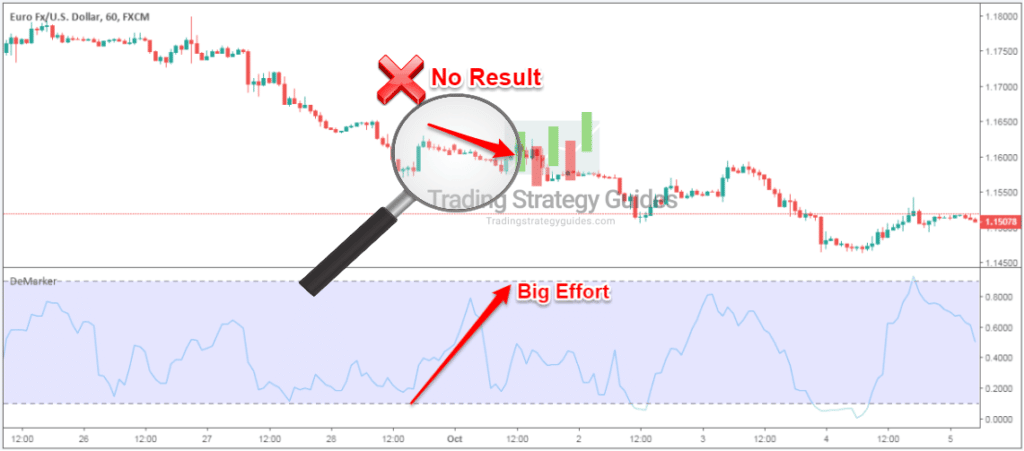
The “effort” of the price can be read by comparing the speed of the price with the speed of the Demarker oscillator indicator.
The correct way to interpret this Demarker chart reading is quite simple. If the effort is big, but the result is small, expect a reversal. In other words, if the Demarker oscillator line advances faster than the price, the price move lacks the bullish momentum. As a result, the smart money isn’t behind this trend move and it’s most likely to reverse.
Note #2: if the result is not proportional with the effort that was put into this price move, expect a trend reversal.
Moving forward, we’re going to outline some practical examples of how to use the Demarker indicator strategy.
Demarker Indicator Strategy
The first trading application you will find in the best Demarker trading guide is how to trade with Demarker as a stand-alone indicator. And later we’ll give you an example of how you can combine the Demarker tool with other technical indicators.
We’re going to explore three typical examples where you can use the Demarker trading strategy.
See below:
Strategy #1: Trade Intraday Trends with DeM indicator
And as a stand-alone indicator, we can use Demarker technical indicator for trend following strategies.
The true nature of trend can be gauged by the Demarker fluctuating curve. We have developed a three-step trading process to identify and trade intraday trends by analyzing the Demarker curve oscillations.
Follow this three-step tutorial to catch intraday trends with DeM indicator:
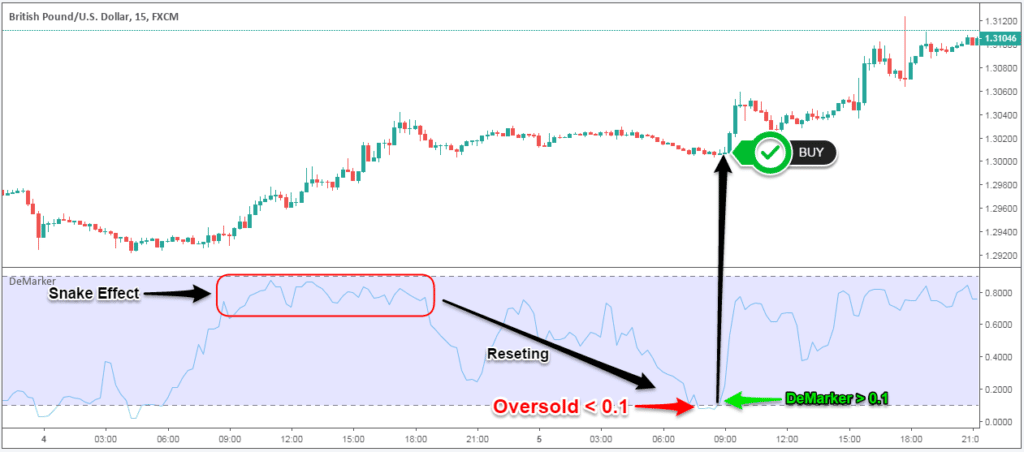
- Use the 15-minute time frame.
- Look for time periods where the Demarker curve develops the snake effect – see more on this below.
- Wait for the Demarker oscillator to reset and return to the oversold reading of 0.1.
- Buy once the Demarker curve crosses back above 0.1 levels.
The snake effect is simply a time period where the Demarker curve oscillates within a very narrow band. The snake effect must develop near the 0.9 level.
The Demarker curve becomes more responsive to the price because it doesn’t smooth price data. That’s why we can pinpoint trade entries with the accuracy of a sniper.
In terms of exiting a profitable trade, you can use one of our exit strategies or simply use your preferred method to exit a trade.
Now let’s see the second trade application of DeM indicator.
Strategy #2: Catch Tops and Bottoms with DeM indicator
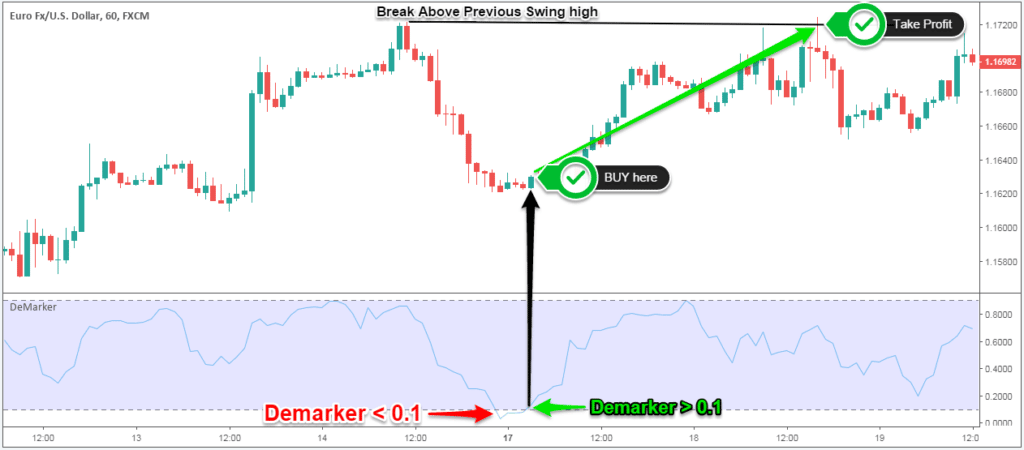
The Demarker oscillator is bounded between values of 0 and 1.0, which gives us the opportunity to identify market tops and market bottoms with a minimum level of risk involved.
By using our 0.1 and 0.9 levels to identify oversold and respectively overbought readings in the market, you eliminate a lot of the false signals.
Note #4: As a general rule, in terms of exiting a profitable trade, we should always use a different strategy than our entry strategy.
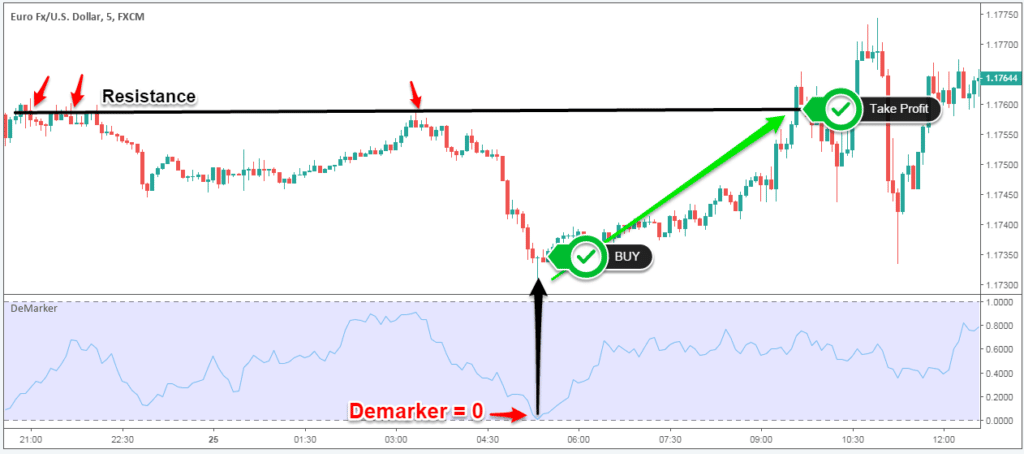
If you want to go one step forward, you can only use the very extreme situations, the 0 and 1.0 levels to identify oversold/overbought readings.
But this will reduce even more from the potential trade opportunities.
Note #3: If you use the 0.0 and 1.0 oversold/overbought readings make sure you treat these trading opportunities as quick scalping trades.
Let’s see what the best combination of technical indicators are so you can incorporate the Demarker indicator.
Strategy #3: Combine DeM Indicator with OBV Volume Indicator
The best combination of technical indicators is between the DeM indicator and the On Balance Volume.
The OBV indicator is based on the idea that both the volume and the price activity are equally important. In this regard, the OBV combines both price and volume to show you the total amount of funds going in and out of the market.
The main idea behind the On Balance Volume indicator is that the market price will follow where the volume flow is going.
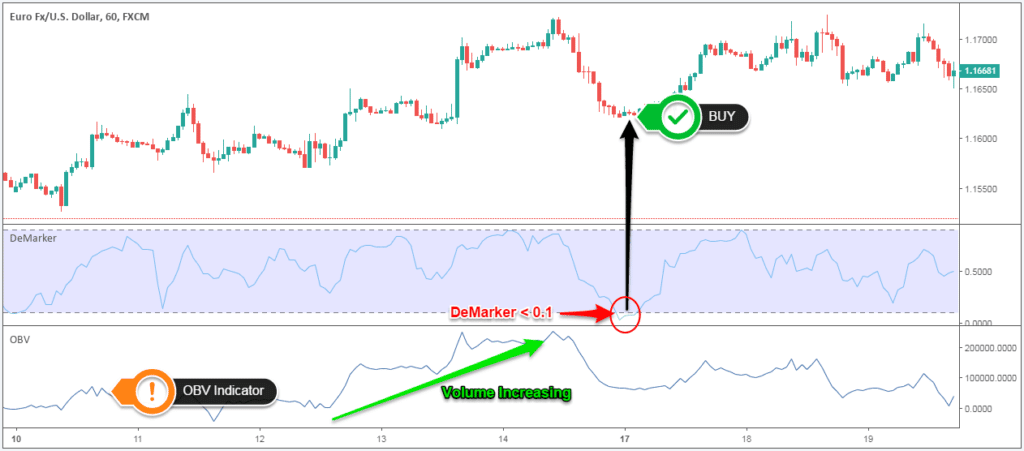
The way you can use this Demarker trading strategy is simple. Look on the OBV to read the market bias. If volume is increasing, then we only want to buy thus we would only look for oversold readings on the DeM indicator.
Conclusion – Best Demarker Trading Guide
The best Demarker trading guide was designed so it can give you different perspectives on the price action. The same technical indicators can be used in multiple ways once you understand how it works and how to correctly interpret its technical readings.
Make sure you practice on a demo trading account each trading system outlined through this step-by-step Demarker strategy guide before committing any real money. Don’t forget that the Forex Demarker indicator is a momentum oscillator that has much applicability through which you can trick the market. Also, read our guide about the Forex Power Indicator.
Thank you for reading!
Feel free to leave any comments below, we do read them all and will respond.
Also, please give this strategy a 5 star if you enjoyed it!
[ratings]
Please Share this Trading Strategy Below and keep it for your own personal use! Thanks Traders!




The strategy is on point
Thank you for sharing this. It clears all the challenges I had using the DeM indicator. Your idea of combining it with the OBV is also awesome and fantastic. Thank you once more.
Thank you!