Best Doji Strategy – The Lucky Star for Profitability

The best Doji strategy can help you isolate the trade with a very simple Japanese candlestick pattern. Learning to trade with candlesticks can help you improve your trading outcomes and trade with a greater sense of precision. As with most things, not all price patterns are created equal and the Doji candlestick has its own features. This will be a great introduction to different types of Doji, and also a great candlestick pattern strategy that will help you trade as fast as the market changes.
If this is your first time on our website, our team at Trading Strategy Guides welcomes you. Make sure you hit the subscribe button, so you get your Free Trading Strategy every week directly to your email.
The Doji strategy makes use of a very small Japanese candlestick pattern that has a similar appearance to a plus sign or a cross. That’s the reason why sometimes it’s referred to as a Doji Star. If you want a reliable Japanese candlestick strategy, you’ll need a more sophisticated trading approach. Trading Doji candlestick as a stand-alone trigger signal is a bad idea.
You need a well-detailed trading plan to face the smart money aka hedge fund managers and institutional investors. As a retail trader, you need to step up your game and we’re here to facilitate that road for you.
Moving forward, you’re going to learn the different types of Doji patterns, what a Doji candlestick is, and how they can help you make more informed trading decisions.
Doji Candlestick Definition
What are Doji candlesticks?
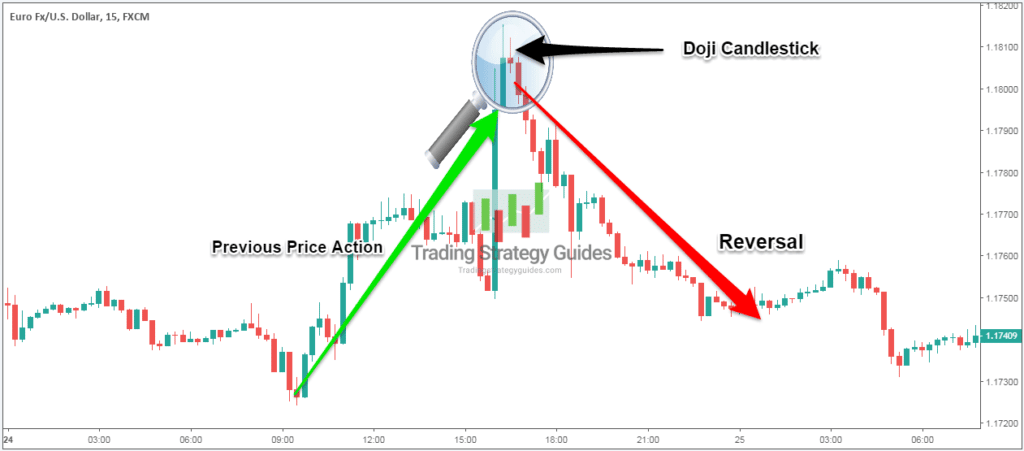
In candlestick chart trading, the Doji pattern is one of the most visible reversal signals in the market. In essence, Doji is a key trend reversal pattern. However, it can also signal a pause in the trend. It all depends on the location and where it’s positioned within the trend.
The Doji bar pattern carries a level of indecision in the market. From a psychological point of view, the Doji pattern displays a tug-of-war between buyers and sellers.
How to recognize a Doji candle?
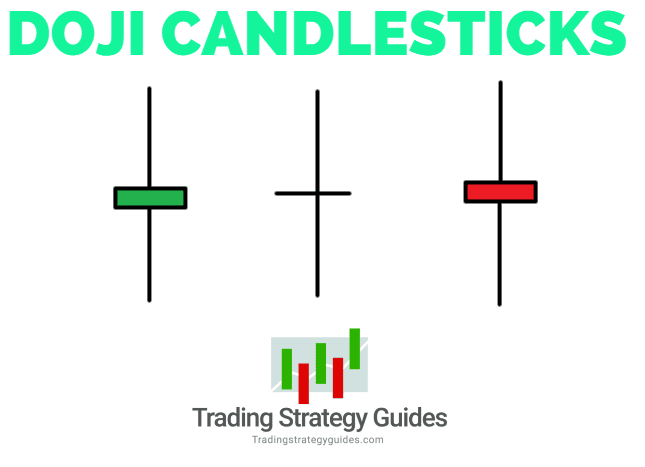
It’s very simple. Look for any candlesticks that have these two characteristics:
- Very small body, centered between the upper and lower wicks.
- And longer upper and lower wicks.
The main feature of a Doji bar is that the closing price is the same or very close to the opening price. During the time period selected, when a Doji bar is formed, the price will move above and below the opening price, but by the end of the selected time period, it closes near the opening price.
The end result of this battle is a standoff. Neither the bulls nor the bears managed to gain control of the market.
Note #1: In technical analysis, the Doji candle is a neutral pattern if it’s used as a stand-alone candlestick.
However, if the Doji candle it’s used in conjunction with the preceding price, we can establish a bullish or bearish bias.
In technical analysis, the Doji pattern probably is the most frequent chart pattern. This is the reason why you need further confirmations before to trade this technical pattern. Trading it alone is a very bad idea unless you really want to blow your account in no time.
Let’s now see how many different types of Japanese Doji patterns are out there.
See below:
Types of Doji
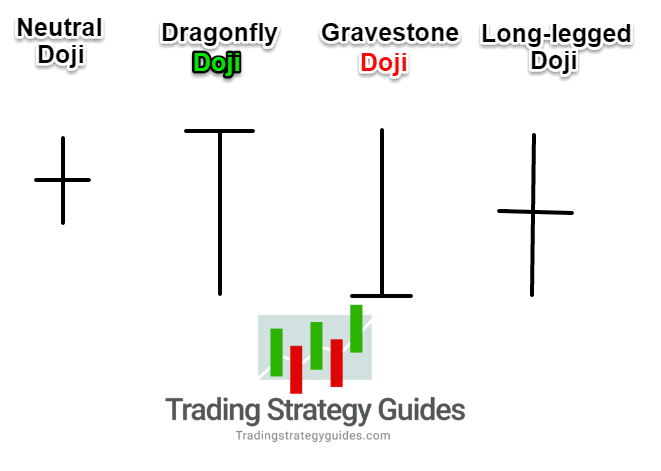
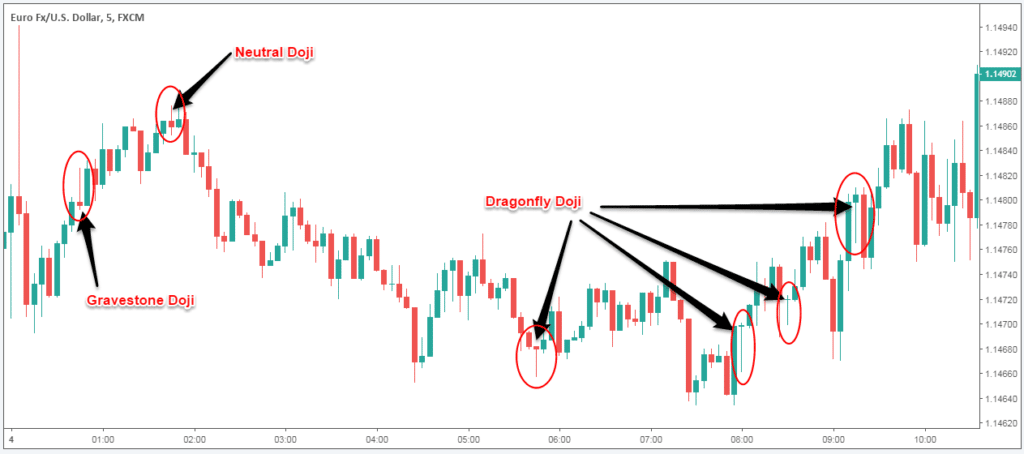
This is an introduction to types of Doji candlestick patterns that you can encounter in the markets. In the field of technical analysis, we can distinguish four types of Doji patterns:
- Doji Candlestick or Neutral Doji – the upper and lower wicks or shadows are equal and shorter.
- Gravestone Doji – both the open price and closing price are near the bottom of the shadow. The main feature of the Gravestone Doji is the long upper wick which is a common reversal pattern.
- Dragonfly Doji – is the opposite of a Gravestone Doji thus it’s found at the end of a bearish trend. In this case, both the open and closing prices are near the top of the wick. The main feature of the Dragonfly Doji is the long lower wick which is a common reversal pattern.
- Long-legged Doji – the upper and lower shadows are very long and the body is very small. The long-legged Doji shows that the bull and bear battle has intensified.
The above graph represents the ideal shape of a Doji bar. However, in real chart examples, they can take many different forms and shapes as long as the closing price is very close to the opening price.
See below:
Let’s now learn how to trade the Doji candlestick pattern the right way.
See below:
Best Doji Strategy
The best Doji strategy is the hit-and-run trading strategy that will give you quick profits. We have a very unique approach when trading this very little candlestick pattern. We’re going to reveal our secret on how to trade Doji Star candlestick.
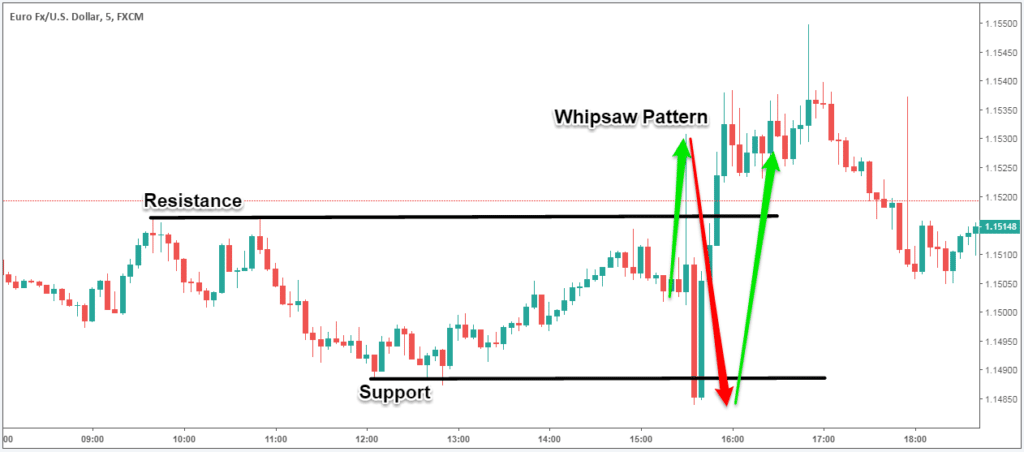
A lot of the problems when trading the Doji, especially the neutral Doji, are that you’ll get many whipsaws. This often leads to prematurely being stopped from your trades.
A whipsaw pattern involves price moving chaotically above and below a certain key support and resistance level. Whipsaw patterns are also referred to as false breakouts. We have developed our Japanese Doji trading strategy around this price feature.
We used the whipsaw pattern in combination with the Doji candle and trend analysis to our advantage. The whole Japanese candlestick strategy is based on our preferred time frame, the daily chart.
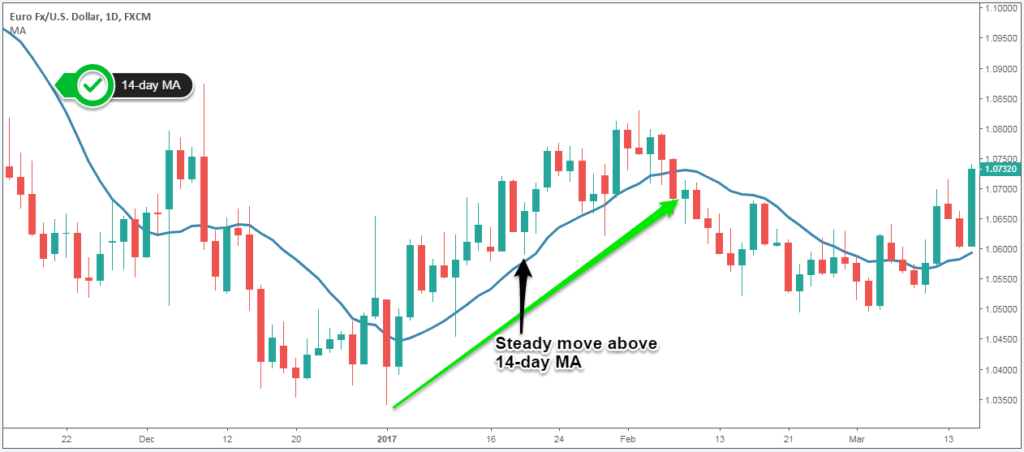
The only technical tool we would need for the Doji trading strategy is a 14-period simple moving average plotted on the daily time frame.
Now, before we go any further, we always recommend taking a piece of paper and a pen and noting down the rules of this Doji strategy.
For this article, we’re going to look at the buy side.
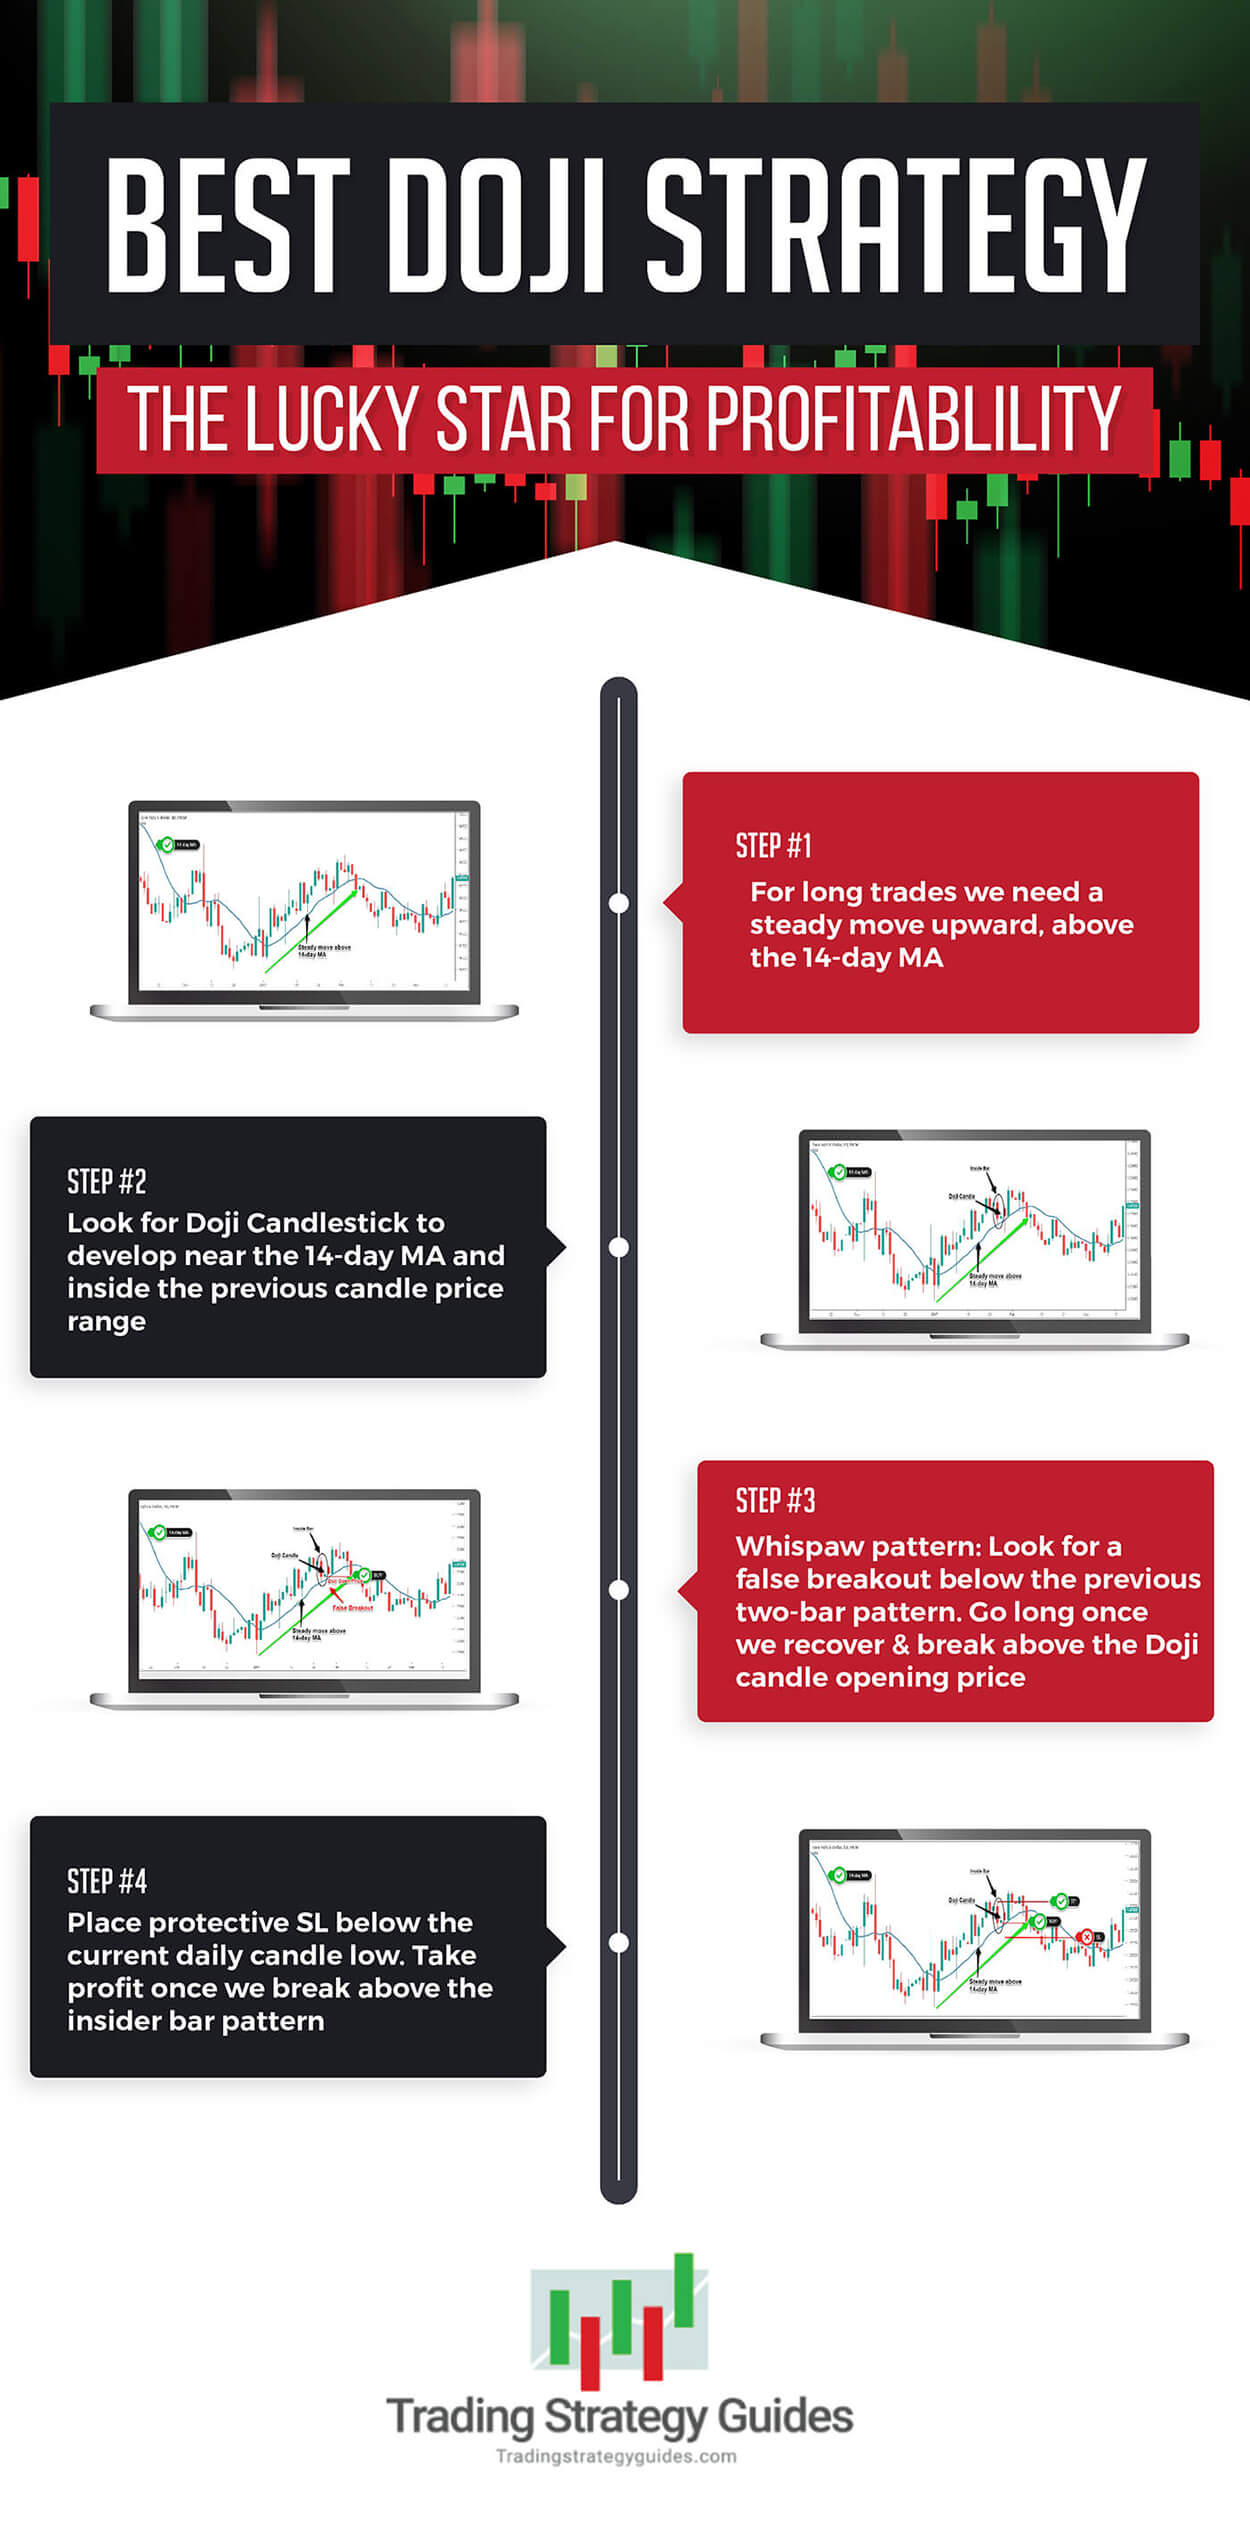
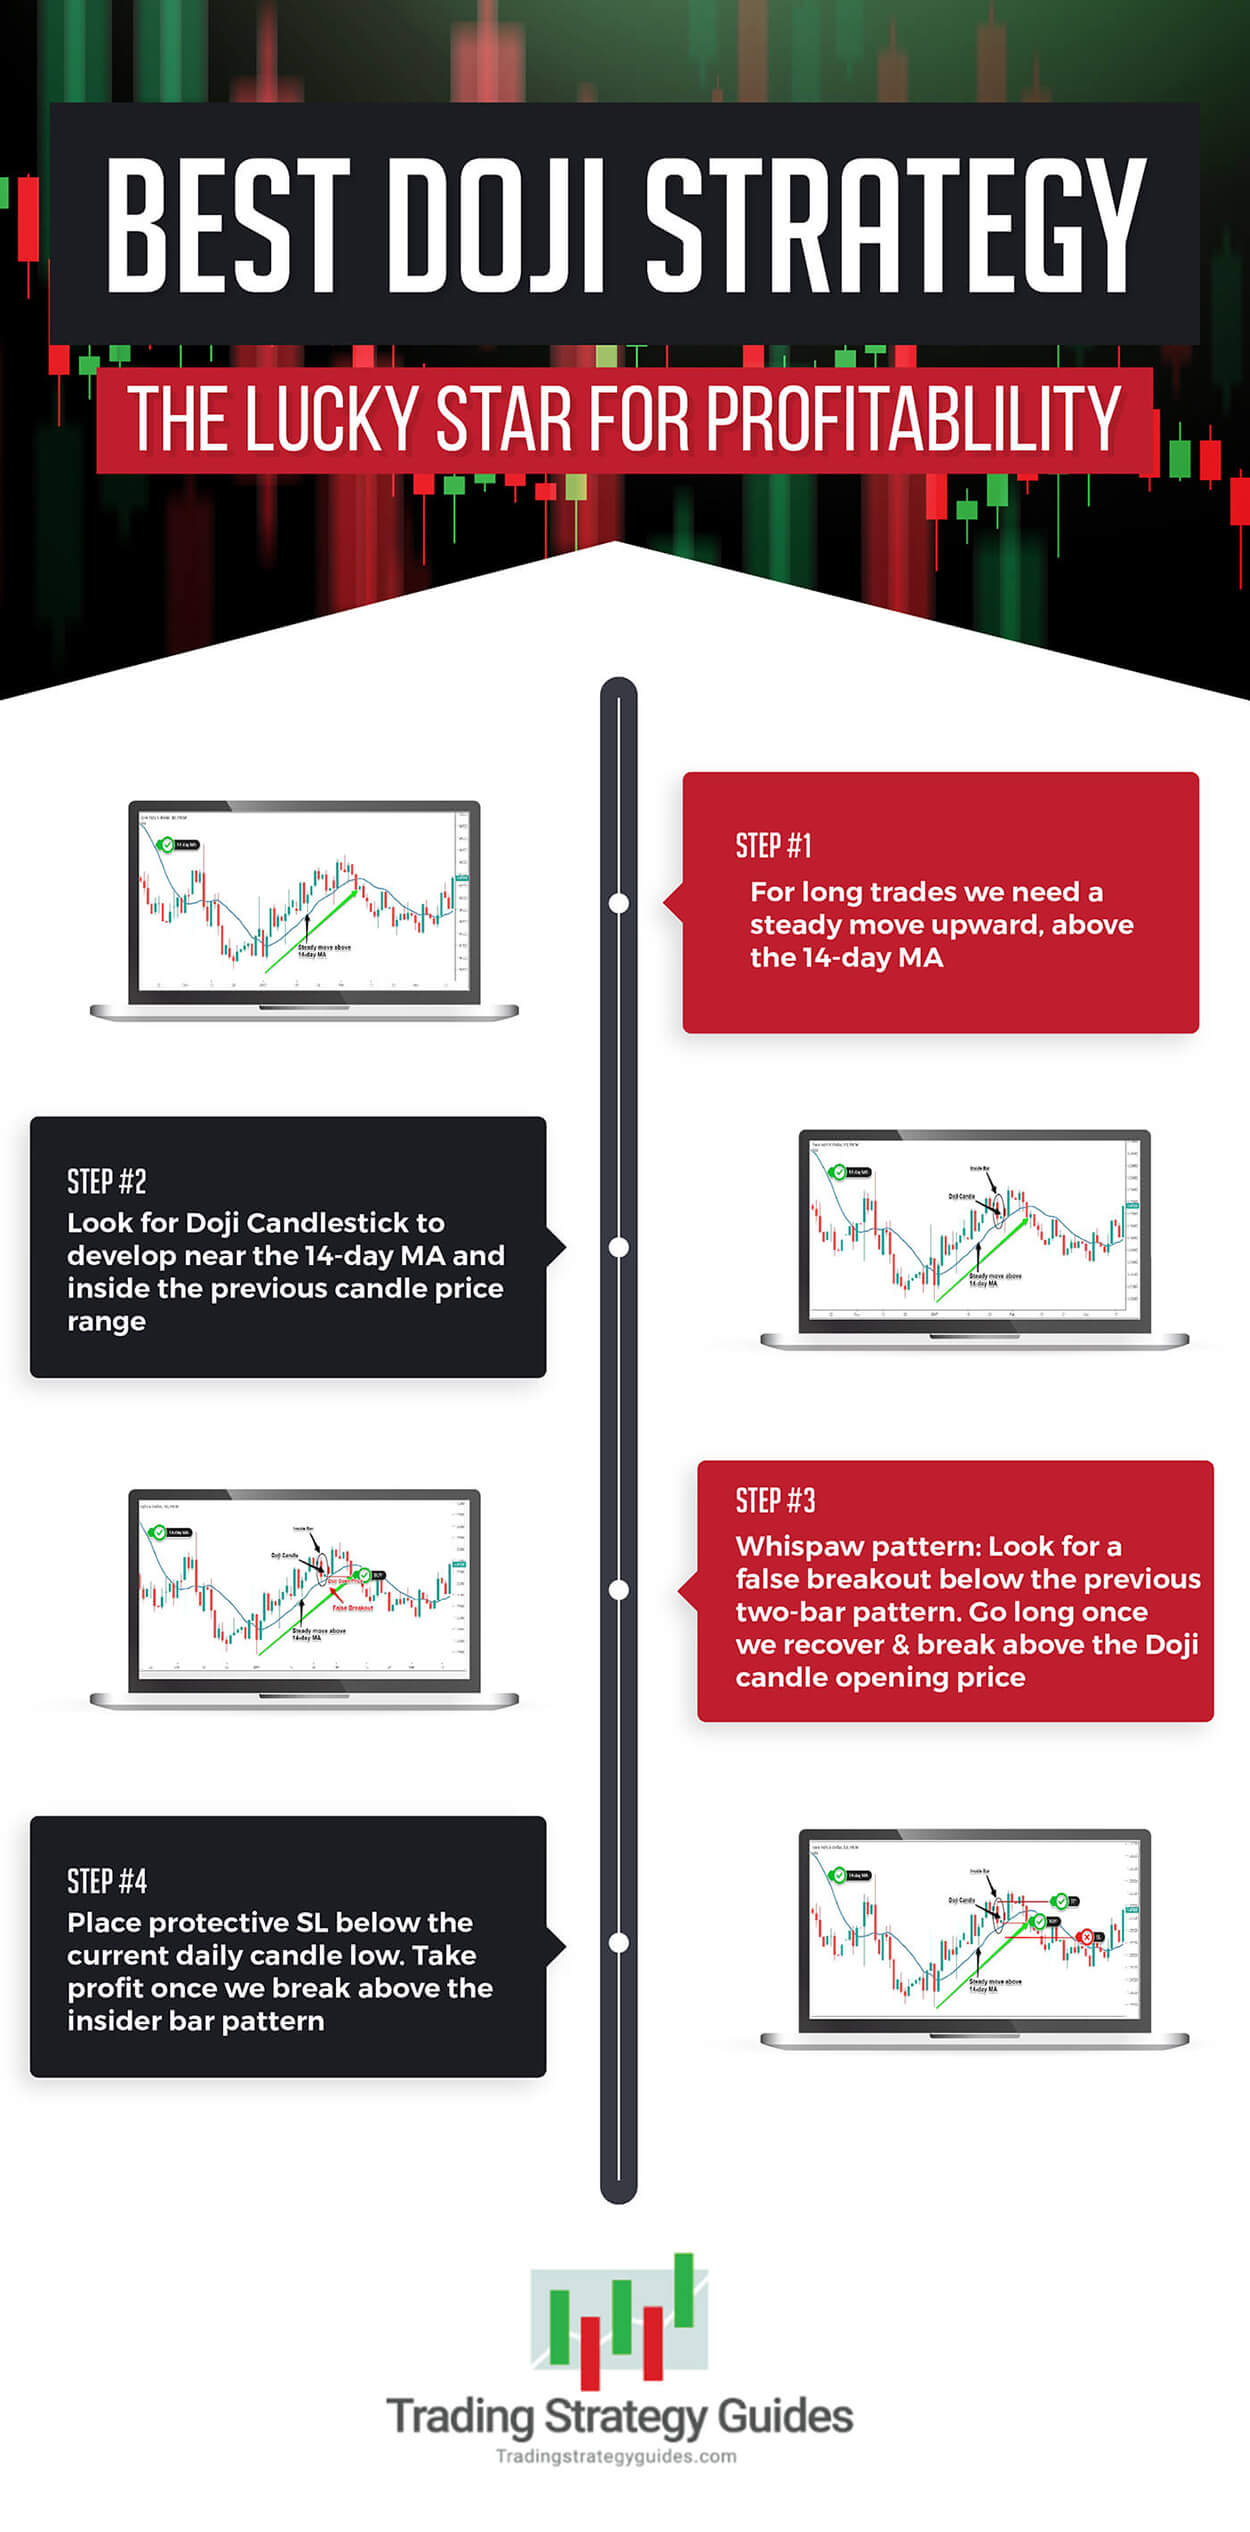
Step #1: For long trades, we need a steady move upward, above the 14 –day MA
Even though most traders used this Japanese candlestick pattern as a reversal pattern, we have found out through some testing that the Doji candle performs best as a continuation pattern. So the first step we need to undertake is to determine the trend direction.
When we see the price moving steadily upwards above the 14-day MA we have enough reasons to believe an uptrend is in progress.
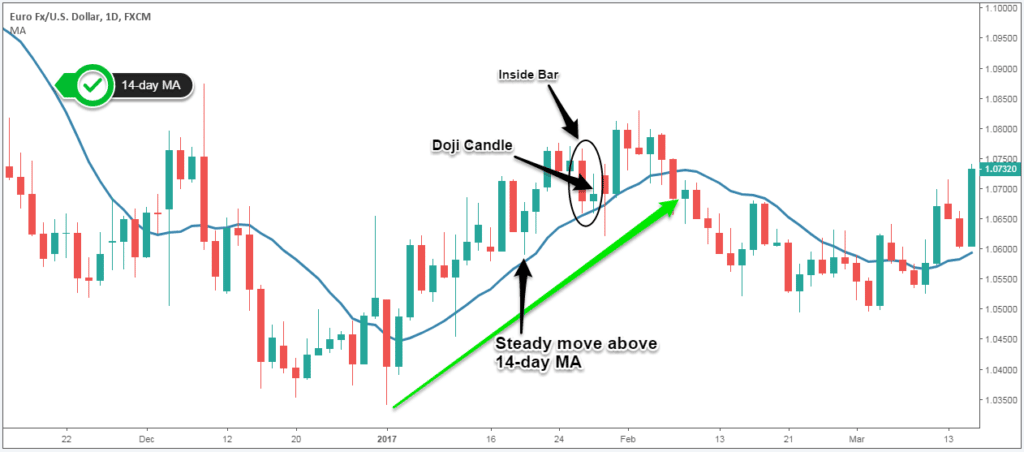
Step #2: Look for a Doji Candlestick to develop near the 14-day MA and inside the previous candle price range.
Next, there are two more conditions that need to be satisfied for a valid trade setup. The first thing to consider is the location of the candlestick setup. We need the Doji candle to develop near the 14-period MA.
Second, we need the Doji candle to be contained inside the price range of the previous pattern. Basically, this will lead to the formation of another pattern called an inside bar.
So, we have a pattern within a pattern.
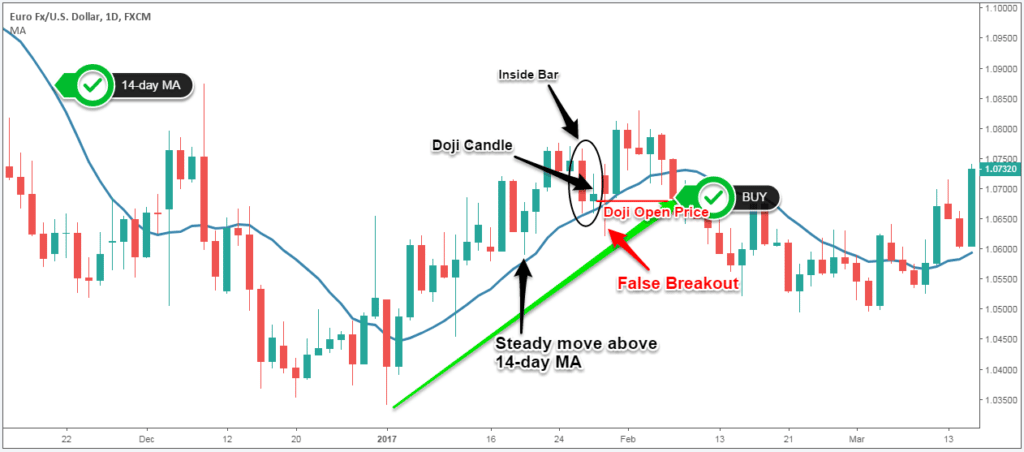
Step #3: Whipsaw pattern: Look for a false breakout below the previous two-bar pattern. Go long once we recover and break above the Doji candle opening price
Now, we’re going to bring to light how we use the whipsaw pattern to our advantage.
The Doji candles are very well-known candlestick patterns for producing a lot of false breakouts. We also know that a break of a level against the prevailing trend has fewer chances of succeeding.
So, by putting all these pieces of the puzzle together, we were able to develop one of the best Doji strategies, which eliminates the scenario where your stop loss is prematurely triggered.
After the false breakout, we wait for the price to recover and we only buy once we get a close above the bullish Doji candle opening price.
Note #2: We want everything to happen within the first candle after the Doji bar. So the false breakout and our entry should be immediately on the next bar following the Doji candlestick.
Let’s now determine an appropriate place to hide our protective stop loss and a proper way to exit our trade.
See below:
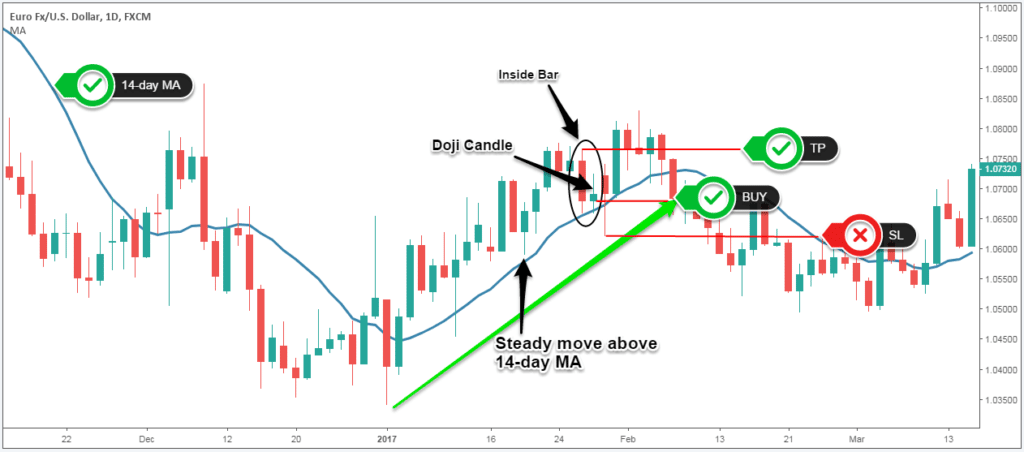
Step #4: Place protective SL below the current daily candle low. Take profit once we break above the inside bar pattern.
We aren’t going to stay in this trade for a very long period of time. That’s the reason why we exit our profitable trade once we break above the inside bar pattern. When it comes to placing our protective stop loss, we can hide it below the low of the candle that triggered our entry.
Conclusion – Best Doji Strategy
Candlestick patterns, like Doji, can be very informative if we want to get a better read of the constant battle between buyers and sellers. But, bullish and bearish Doji candlesticks work best when they are used in combination with other technical tools and in conjunction with the trend.
In general, the more sophisticated and elaborated your Doji trading strategy is, the more likely you’re to make informed trading decisions. Even though we like to trade bullish and bearish Doji as continuation patterns, you can still try to use them as a reversal pattern. Just make sure you backtest what you’re doing if you don’t want to end up in a position where your account balance gets damaged.
Thank you for reading!
Feel free to leave any comments below, we do read them all and will respond.
Also, please give this strategy a 5-star if you enjoyed it!
[ratings]
Please Share this Trading Strategy Below and keep it for your own personal use! Thanks, Traders!





In step#4 why the flase breakout candle is bearish candle that I think It should be bulish candel?